Society for the Conservation and Advancement of Nomography |
||
|
History |
Back in the days of ships of wood and men of iron, there was a simple solution to the problem of having people obtain results from relationships in equation form. In those days, most non-technical people were daunted by "plugging in numbers" to get answers; often, they would use the wrong system of units, use "25" for "twenty-five percent" where "0.25" was the appropriate input, and so on. If the equations involved several variables, tables became unwieldy. And implicit solution, or "working backwards," was almost unthinkable. This was a task that was easy (although still error prone) for professionals, yet very hard for others. The typical boundary that needed crossing in those days was going from the design engineer in his office to the machinist on the shop floor. Today we have pocket calculators and personal computers with spreadsheets, but the barrier still exists. Necessity required a simple, elegant solution. As is usually the case in such situations, graphics came to our rescue. |
|
|
Graphical methods allow us to capture relationships among variables, and hence "trick" people into “solving” equations without knowing it. The device is known as the nomograph.[1] I first came across them in my freshman engineering graphics course at The Cooper Union in the early 1960's. To get the answer, the user simply lays a straightedge across some specially arranged and calibrated scales. If serial calculations are required, multiple instances of this technique can be chained together, all on one sheet of paper. The engineer does the hard work of creating the nomograph, which is often non-trivial. On the other hand, the master nomographer always produces a chart that is ridiculously simple to use, and pretty much impossible to misuse. This technique, documented by d'Ocagne around 1900, was highly developed by the worldwide engineering community during the period from around 1925 to 1975, when the advent of pocket calculators and computers caused it to go out of fashion. More than a quarter of a century later, as is frequently the case of useful things that fall by the wayside, we await its worthy replacement. In vain, I’m afraid. [1] From the Greek roots nomos (law) and graphein (to write). Nomogram is also used synonymously. |
Nomograms |
|
|
Features |
The nomographer has the job of laying out the nomograph so that it is very easy to use. The directions for use are always indicated right on the nomograph itself. The scales are all labeled so unambiguously that getting the input wrong is impossible. Also, as the scales usually encompass only the regions of interest of the key variables, it is usually clear when one is trying to do something "off the chart." Needless to say, the scales always have the correct system of units indicated, so that errors of this type are minimized. Nomographs have the interesting property of solving equations both explicitly and implicitly. You can find any missing variable or combination of variables by “working backwards.” That is, instead of proceeding with the first two variables and going left to right across the page, one can start with "the answer" and work backwards to see what combination on input variables can get you to that result. Another virtue is the ability to do sensitivity analysis quickly by experimenting with different combinations of variables, holding some fixed and seeing the leeway you have with the remaining ones. Nomographs exactly fit the Barbecue Joe definition of "Good Engineering": It's when someone else worked hard so that you don't have to! |
|
|
The natural disadvantage of nomographs is that they have limited precision. On the other hand, the precision is usually more than sufficient for most engineering applications, and the nomograph has the compensating advantage of allowing you to do calculations rapidly. In fact, once you know the nomograph in question, the calculation is almost instantaneous, much like a "graphical table lookup." All you have to be able to do is visually interpolate a scale. For example, generations of aircraft pilots have used nomographs, because while in the air speed is often of the essence. One of the disadvantages these days is that people want things on their screens. Nomographs are hard-copy by their nature. One can create very fancy interactive applets that simulate what can be done with nomographs, but this is really using a cannon to kill a fly. |
Limitations |
|
|
Examples |
Here is an example of an amusing application of nomography: Gordon Bell's Nomograph Relating to Computer in use, Birth date & Age (as of 2002) and Age of First use. Here is an example of a fancy fly-killer: Olympus Digital Microscope Color Temperature Filter Nomograph. Some really nice work has recently been done by Ron Doerfler, who provides a gentle introduction to the subject and some really nifty examples. Leif Roschier hosts a very complete discussion forum that can help beginners get started. I produced a nomograph to accompany an article on Optimal Growth and Productivity in Organizations.
Here is a nomograph I recently constructed to help people choose between two alternate fuels, each with its own mileage and price.
And here is one that allows race car drivers to figure out how much time they lose going through a narrow part of a race course. The actual speed through this short segment is lower than the target speed for the overall circuit, so drivers like to "bank" some extra time entering it. That way, upon exit they can resume their target speed and hit their exact time target for the entire course.
|
|
|
Now, thanks to Leif Roschier there is a tool that enables one to construct nomographs programmatically. If you go to the PyNomo web site you will discover a complete system for creating nomographs, including automatically scaling the representation to maximize the allowable precision. This web site is a tour de force and should become part of every nomographer's tool kit. The programming consists of adapting some standard Python scripts. From a standing start, a very professional-looking nomograph can be constructed in fifteen to thirty minutes. And it is all available as Open Source. Release 0.2.2 came out in October 2009. There is also an active discussion forum for PyNomo. As a result of experimenting with PyNomo, I discovered that my "pride and joy" nomograph above was really suboptimal, despite being published in a journal article and appearing in a chapter in my book. Working with PyNomo, I was able to improve the presentation, which is given below. The entire left-hand portion is revised, with a significant improvement in precision; also, an additional variable has been introduced by creating a double scale at the right-hand edge. The compound nomograph relates a total of eight different variables, yet requires only two manipulations with a straightedge! Note that I still used my old tools for the final version; however, it was the ability to quickly experiment with alternate approaches in PyNomo that enabled the breakthrough. PyNomo is very valuable both as a rapid prototyping tool and as a means of producing final production-quality nomographs. Bravo, Leif!
|
PyNomo |
|
|
Medical |
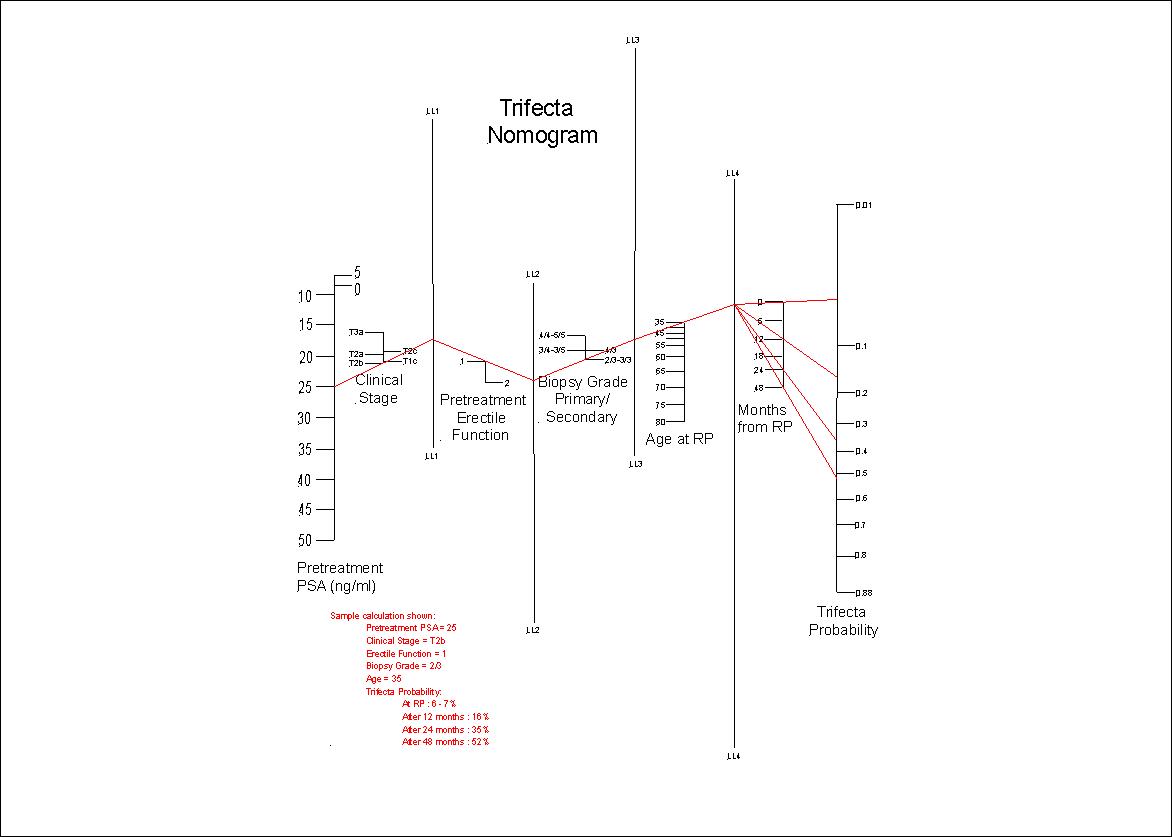
There is a great historical tradition of medical nomography, started by Lawrence Joseph Henderson. Professor Thomas L. Hankins has written a wonderful article entitled " Blood, Dirt, and Nomograms: A Particular History of Graphs." In this 1997 History of Science Society Distinguished Lecture, the author describes how, in the 1920's, L. J. Henderson, a Harvard physiologist and the first president of the History of Science Society, attempted to analyze mammalian blood solely as a physical-chemical substance. He found that the only way he could describe a chemical system as complicated as blood was by a diagram called a "nomogram." Henderson worked with and was greatly influenced by d'Ocagne. The lecture tells the history of Henderson's nomogram and of nomograms in general. It describes the origins of graphs in the eighteenth century, their development in nineteenth-century engineering practice, and their importance in the twentieth century for describing physical and chemical systems. The "blood" in the title of the lecture refers to Henderson's seminal 1928 book, " Blood. A Study in General Physiology." The "dirt" refers to the most common used of nomograms in the 1800's, that of simplifying the cut-and-fill calculations needed for grading in civil engineering. In the past ten years, Dr. Michael Kattan has used nomograms in several hundred publications to aid in the diagnosis and evaluation of treatment options for various types of cancer. He has almost single-handedly created a renaissance in the use of the tool in medicine. We are very pleased to have published an article with Dr. Kattan in Seminars in Oncology called "What Is a Real Nomogram?" Here is a nomogram from that article.
We discuss medical diagnostic testing protocols using Bayes' Theorem as a starting point. We work a complete example from start to finish, and employ original nomograms of our own devising to facilitate calculation; PyNomo was extremely helpful in our production of these nomograms. Finally, we use our tools to comment on the efficacy of PSA screening in the early detection of prostate cancer. I gave a talk based on this article at Stanford University in the spring of 2012. You can see a YouTube video of it here.
The Three Musketeers of Nomography now have a web site. We provide a variety of nomographic services as well as high quality nomograms on heavy card stock. A link to the UMAP Journal article is also available there.
|
|
|
Click here to e-mail Barbecue Joe on the subject of Nomography |
||